



SIOP (Sales Inventory Operations Planning), also known as S&OP and IBP (Integrated Business Planning), relies on meaningful metrics to identify gaps, evaluate tradeoffs, and make better business decisions. The best SIOP metrics don’t simply measure past performance. They also provide early warning signals that help executives align demand, supply, inventory, capacity, and financial objectives before problems impact customers or profitability.
Although every business should tailor its SIOP scorecard, these five metrics provide the foundation for most successful SIOP processes.
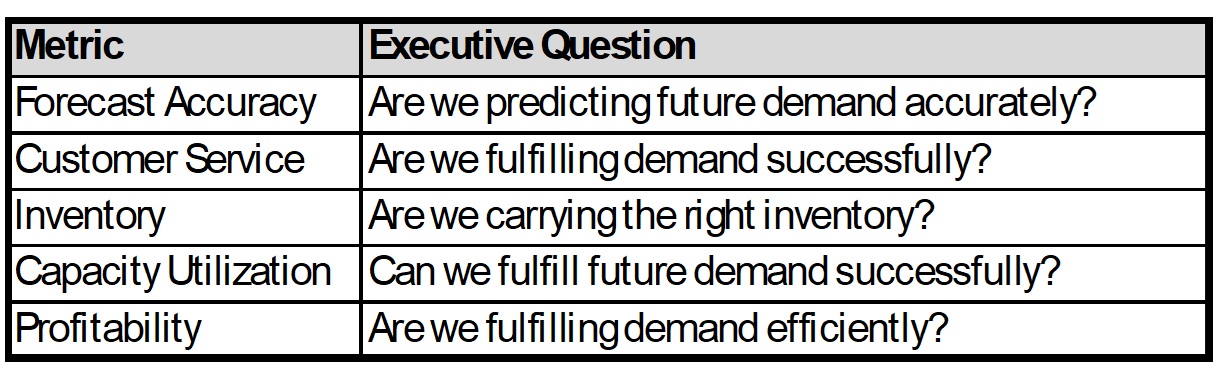
#1) Forecast accuracy: How accurately are we predicting future demand?
Forecast accuracy is one of the most important metrics in SIOP because every downstream decision depends on the quality of the demand plan. The key is measuring forecast accuracy at the level where business decisions are made, whether by product family, customer, market, manufacturing site, bottleneck work center, or another logical grouping. Mature SIOP processes also emphasize leading indicators rather than simply reporting historical results. Sales pipelines, quotes expected to close, projected capacity utilization, inventory projections, and anticipated service levels help executives identify changing conditions early and take action before problems impact customers or profitability. Learn more about building a reliable demand plan in our article, Creating Predictable Revenue with Demand Planning Best Practices.
#2) Customer Service: Are we fulfilling demand successfully?
Customer service should be a primary focus of every SIOP process because if customers cannot rely on your performance, they will quickly find another supplier. Our most successful clients routinely monitor fill rate, on-time delivery (OTD), on-time-in-full (OTIF), perfect order performance, and, when available, key customer scorecards. Mature SIOP processes also emphasize leading indicators that identify potential service issues before they occur. Metrics such as order bookings, backlog trends, projected past due orders, on time to start production, and projected shipping performance help executives proactively address gaps and maintain high service levels as demand and supply conditions evolve.
#3) Inventory: Are we carrying the right inventory?
Inventory performance is one of the clearest indicators that demand and supply are aligned. Too much inventory ties up cash, reduces cash flow, consumes warehouse space, and increases working capital requirements, while too little inventory results in shortages, expediting, missed sales, and poor customer service. Our most successful clients routinely monitor inventory turns, inventory value, days on hand (DOH), excess and obsolete inventory, and inventory by category or location. Mature SIOP processes also emphasize leading indicators such as projected inventory availability, projected inventory shortages, and future inventory positions so executives can proactively rebalance inventory before service levels or financial performance are impacted.
#4) Capacity utilization: Can we fulfill future demand successfully?
Capacity planning and utilization determine whether your organization has the manufacturing capacity, labor, suppliers, warehouse capacity, transportation, and other resources required to support the demand plan. Without sufficient capacity, customer service suffers, lead times increase, and growth opportunities are lost. Learn more in our article, Capacity Planning Best Practices to Support Sales Growth. Our most successful clients routinely monitor available versus required capacity by bottleneck work center, critical equipment, high-skilled resources, key suppliers, warehouse space, and other constrained resources. Mature SIOP processes also emphasize leading indicators such as projected capacity utilization, master production plan requirements, supplier forecasts, projected labor requirements, and available versus required capacity over the planning horizon so executives can resolve constraints before they impact customers or profitability.
#5) Profitability: Are we fulfilling demand efficiently?
SIOP should improve profitability by aligning demand with the most efficient use of resources. As companies optimize inventory, capacity, procurement, production, logistics, and the broader supply chain, they reduce unnecessary costs while improving financial performance. Our most successful clients routinely monitor gross margin, EBITDA, customer profitability, product profitability, and operating profit to understand the financial impact of planning decisions. Mature SIOP processes also emphasize leading indicators such as projected gross margin, forecasted cash flow, projected working capital requirements, and planned capital expenditures so executives can evaluate scenarios and make informed investment decisions before committing resources. For examples of how these metrics support pricing, margin, and growth decisions, read our article, Revving Up Sales & Maximizing Customer & Product Profitability with SIOP.
The specific metrics should reflect your business strategy and the decisions your executive team needs to make. Every successful SIOP process relies on a concise set of measurements that aligns demand, supply, inventory, capacity, and financial performance. When executives review these metrics on a consistent cadence and act on the insights, SIOP becomes a strategic decision-making process that drives predictable revenue, stronger customer service, improved cash flow, and profitable growth.
Read our SIOP FAQ on what KPIs you should track. For a deeper dive into implementation strategies and best practices, read our book, SIOP (Sales Inventory Operations Planning): Creating Predictable Revenue and EBITDA Growth.
Have questions about SIOP?
Explore our growing SIOP FAQ to find answers to common questions about implementation, technology, KPIs, business outcomes, inventory, profitability, forecasting, and more.
Did you like this article? Continue reading on this topic:
Maximizing Performance and Margins with SIOP
© Lisa Anderson Original article published October 2014, updated August 2026.